vimeoのアクセス解析について
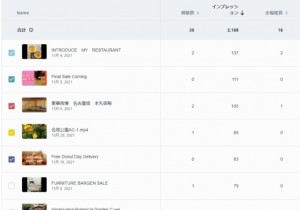
Vimeoのアクセス解析は様々な観点から分析出来るようになっています。今回はアップロードされた動画ごとにインプレッションがどれぐらい現れたかを示す表になります。
About access analysis of vimeo
Vimeo’s access analysis can be analyzed from various points of view. This time, it will be a table showing how many impressions appeared for each uploaded video.
動画はこの他にも、あります。そこで上位の動画だけになります。一位がレストラン紹介ビデオで、137回サムネイル画像が露出されています。二位がfinal sale comingで111回露出、3位が名古屋城本丸御殿で105回露出となります。4位が名城公園です。
There are other videos as well. Therefore, only the top videos will be available. The first place is the restaurant introduction video, and the thumbnail image is exposed 137 times. The second place is the final sale coming, which is exposed 111 times, and the third place is the Nagoya Castle Honmaru Palace, which is exposed 105 times. 4th place is Meijo Park.
この数値は動画ごとの露出回数ですが、どこの国でサムネイル画像が出されたかの言うデータもあります。
それは次回にします。
このインプレッション÷視聴数が、クリック率ということになります。
This number is the number of exposures for each video, but there is also data that says in which country the thumbnail image was released.
I will do it next time.
This impression ÷ number of views is the click rate.
